 |
After such a phenomenal year as 2013 was for stocks — the S&P 500 Index had its biggest gain in 16 years — “overbought” is a word often tossed around.
The very name of it can make traders believe that prices are too high and that a price decline should be expected. If you are long, the implication is that you should take profits before the eventual decline erases all your gains.
First, let’s have a look at just how strong the bull market was for much of 2013. Below is the weekly chart of the SPY, the ETF that attempts to track the S&P 500. I placed the 50-period moving average in the chart to help recognize that strength. I also placed the relative strength indicator (RSI) below prices. (This indicator was created by J. Welles Wilder Jr., and introduced in his book New Concepts in Technical Trading Systems, published in 1978.)
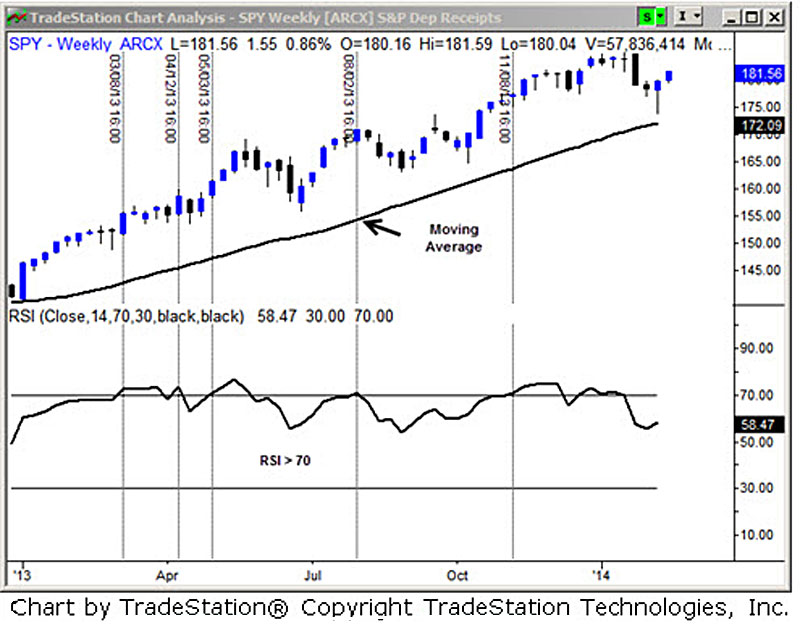
The RSI is very often used to measure price momentum. One popular use of the indicator is to identify an overbought market condition, if the 14-period RSI is above the value of 70. I placed a vertical line in the chart when the indicator first crossed above that threshold.
As you can see in the chart, the high levels of the RSI meant nothing in regards to indicating a change in trend. If a trader sold their portfolio simply because this indicator was “overbought,” they would have missed much of the excellent gains for the entire year.
Prices most often continued higher when the RSI reached a value of 70, the chart shows. Every once in a while, prices would decline, but the drop would be several weeks later, or it would be of a short duration in time and price.
In fact, many traders missed the bull market of 2013 because they were scared to enter the trend, and more than a few analysts on television were scaring listeners about an overbought market or the lofty levels of technical oscillators.
This is why I say that the terms overbought and oversold are the most expensive terms in trading. These terms lead traders to make the wrong decisions at the wrong time.
For those readers who are familiar with my work, you know that I like to back-test technical indicators and trading methodologies to test for reliability. I did some research on the RSI indicator and tested if prices normally fell after the 14-period RSI reached a value of 70. And here is what I found:

In the past 20 years, if you sold the weekly SPY solely because the RSI was above 70, prices went down only 35 percent of the time.
The exact rules of my test are not that critical. The important point is that prices tended to rally higher after the RSI reached these higher levels. The RSI was totally ineffective in indicating a change in trend.
There are some technical tools that can be used to properly identify an overbought market. The RSI is not one of them.
My advice: Do not sell a stock, commodity, or currency based upon elevated RSI levels. You want your stock to get overbought. Do not let this indicator kick you out of an excellent trade.
Best wishes,
John Sheely
P.S. Want to learn more about how to recognize a big trend by analyzing charts and daily prices? Starting Feb. 24, I will be hosting a three-part course designed to teach investors just like you about the most common technical indicators found on almost every charting platform. Being able to spot these trends can help reduce losses and gives you the potential to generate higher returns. Click this link today to sign up for this informative course presented by The Weiss Center for Investor Advancement.