 |
Here at the Edelson Institute, our long-term view (12-18 months) on the stock market remains bullish.
In fact, our long-term forecast of at least Dow 31,000, and potentially higher, should begin to play itself out as the global sovereign debt crisis sends a surge of capital into U.S equities.
But short-term, not so much.
Here’s why:
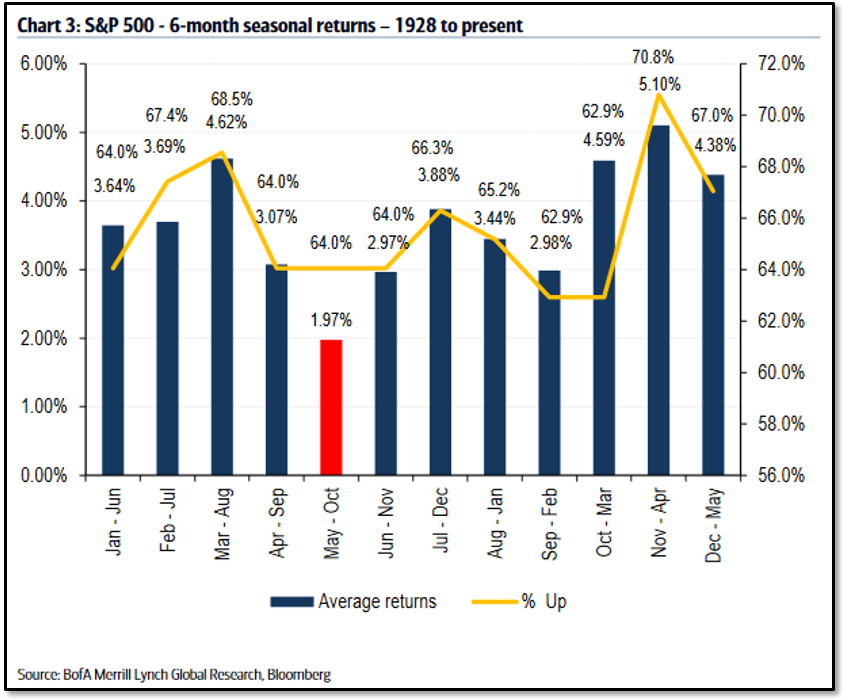
First, we are heading into a seasonally weak period for the equity markets.
You can clearly see from the graph below from Bank of America Merrill Lynch Global Research – whose analysts crunched the seasonal data on the S&P 500 going all the way back to 1928 – that May to October is the weakest six months of the year.In fact, the May-to-October period is up only 64.0% of the time with an average return of just 1.97%. See for yourself …

So, the old saying, “Sell in May and go away” might just hold true because the May-to-October period has the least-robust S&P 500 returns of any six months in the year.
Second, investor confidence is flashing warning signs.
Investor enthusiasm for stocks is nearing extremes, according to the latest Investors Intelligence poll, which shows bullish readings exceeding bearish ones by 58.5% to 17.9%, putting the spread into the “danger zone.” This is a contrarian indicator, so when the spread between the two is over 40%, it usually indicates a temporary top for stocks.
Plus, most of the overall market gains this year can be attributed to just a handful of stocks.
Take the S&P 500 Index for example, which is up nearly 7% year-to-date. Just five stocks make up almost a third of the S&P 500’s gains for the year. That’s right, only 1% of the stocks in the index contribute to almost a third of its return.
So, if you strip out the performance from Apple, Facebook, Amazon, Alphabet, and Microsoft, you would have a sizable haircut in returns and, more likely than not, suffer lower investor confidence as well.
Third, not only are the markets technically overbought at current levels, but the Edelson Institute cycle forecasts for both the Dow and the S&P 500 are also calling for a stock-market decline heading into the summer months.
Take a look below at the Edelson Institute cycle forecast chart for the S&P 500 Index …

You can clearly see that we are nearing a temporary peak for stocks and that we should be heading lower into the July-August time frame.
Now, this doesn’t mean that stocks can’t continue to drift a little higher from current levels. But all of our analysis points to a temporary setback in stock prices, so be careful as we head into this seasonally weak period for the markets.
Here’s how to play it …
With the stock markets at or near record highs, volatility is sitting at a decade low. So, the best and cheapest way to add protection to your portfolio is by buying out-of-the-money put options on an index ETF, like SPY (SPDR S&P500 ETF Fund), QQQ (PowerShares QQQ Trust Series 1), or DIA (SPDR Dow Jones Industrial Average ETF Trust).
Best wishes,
David Dutkewych

{ 4 comments }
Thank very much for your information. With this I am validating my point of view about it, I agree ! That´s very clear ! The good time for the put options trades is coming up or to buy gold ( stocks miners )
Your chart says BUY in may! BUY low,right??
Buy a canoe in May, just before a waterfall!
You have been predicting doom and gloom.In the meantime the market has surged ahead sinificantly.I have lost money making opportunities.What gives.