 |
If you thought last week’s big action in the bond market was a one-time event, look at what’s happened this week!
Again, bond prices have taken a dump. Again, long-term interest rates have jumped. And more so than ever, we have abundant evidence that this megatrend is accelerating:
- The yield on the longest U.S. Treasury bonds is now about to bust through the 4-percent barrier.
- The U.S. Treasury’s regular auctions of its securities are close to bombing, as more and more global investors shun bonds regardless of yield.
- And big money continues to gush out of bond funds to the tune of $153 billion just in the last six months.
As Mike Larson headlined in his Safe Money Report of October, we’re witnessing the biggest interest-rate turn in 37 years!
Last week, I asked: How fast and how far could interest rates rise? How soon will they impact other sectors of the economy? How can you profit from this powerful megatrend?
And on a quest for the answers, I invited you to a voyage through time …
We visited 1959, the last year of the Eisenhower administration, when interest rates were rising like today. Fortunately, though, my father helped Eisenhower balance the federal budget, which, in turn, helping the nation avoid an interest-rate explosion.
We then set our time machine for 1971, when Nixon devalued the dollar, abandoned the gold standard and started the destruction of everything Eisenhower and my father had fought for.
That launched the United States on a decade of rapid monetary expansion, culminating in double-digit inflation and the greatest bond-market collapse of recorded history in 1979-80.
And that’s also when we saw the emergence of an entirely new and formidable force — bond market vigilantes!
The bond market vigilantes are individuals and institutions who own government bonds and who are willing to dump those bonds any time they fear their bonds might go down in value.
It doesn’t matter so much WHY bonds are going down. It could be the fear inflation. It could be the expectation of bigger deficits. Or it could be they’re afraid the biggest bond buyer in the world (the Fed!) is going to pull out, an event that today would be called “tapering.”
That’s actually what happened in late 1979 when newly-appointed Fed Chairman Paul Volcker ended many years of aggressive Fed bond buying. And the consequences in the bond market were chaotic.
Bond market vigilantes dumped U.S. Treasury bonds in such great quantities … and bond prices fell so far, so fast, that the capital of many major banks was wiped out.
Imagine that! We’re not talking about bad mortgage bonds or high-yield junk bonds. We’re talking about supposedly safe U.S. Treasuries! Their capital was wiped out by major losses in long-term Treasury bonds.
Indeed, the bond vigilantes’ power to sell bonds was so great, it forced President Jimmy Carter, a Democrat in a presidential election year, to deliberately push the U.S. economy into a nosedive.
Just to convince the bond vigilantes he was serious about fighting inflation! Just to get them to start buying his bonds again.
Finding all this hard to believe? Then take another look at all the evidence in my column of one week ago, “Your Trip on My Time Machine.”
Then join me here for the second leg of our travel through time, starting with …
1994
We make a brief stop in this year to point out two things:
It’s one of the biggest collapses in the bond market of any full calendar year in history.
And it’s NOT caused by inflation.
Rather, it’s caused almost entirely by bond market vigilantes who are upset about $200-billion deficits year after year, and who are worried that the economy might improve enough to put pressure on the Fed to raise interest rates.
Remember that: Not caused by inflation! And not caused by any major policy change — just big deficits coupled to some improvement in the economy and fear of rate hikes.
1995-2008
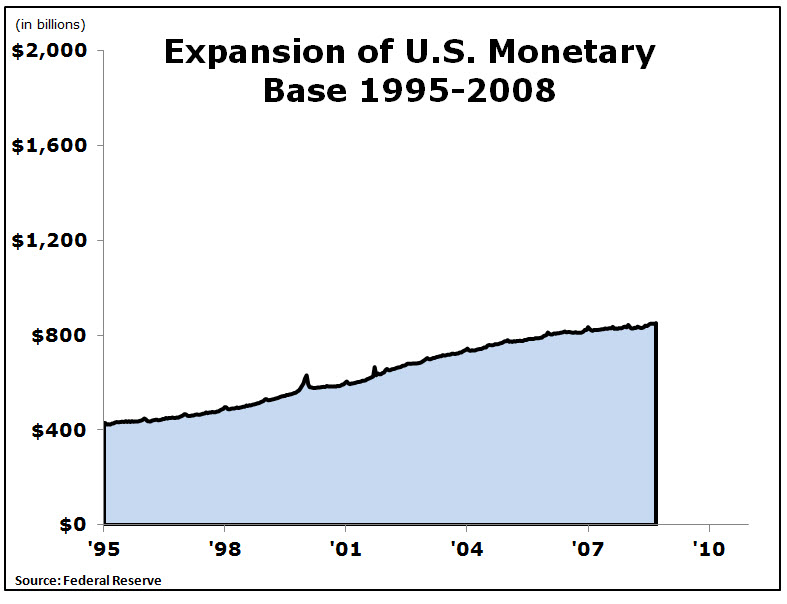
After 1994, the Fed is shell-shocked. It has just witnessed one of the biggest declines in the bond market of any full calendar year. So it starts pushing interest rates down. And it starts pumping more money into the economy.
So let me show you exactly how much. And to do so, let me bring back my chart of the nation’s monetary base — one of the best ways to measure how much money the Fed is pumping into the banking system.
 |
Many experts complain that this growth between 1995-2008 is far too rapid, that it will lead to serious trouble down the road.
And they are right.
It causes a bubble in tech stocks which bursts in the year 2000.
Then, it causes an even bigger bubble in housing which begins to bust in 2006.
2008 – 2013
But if you think this phase of the Fed’s monetary expansion is excessive, if you think the Fed’s money pumping that helps create the tech bubble and housing bubble is crazy, then look at what happens beginning in 2008!
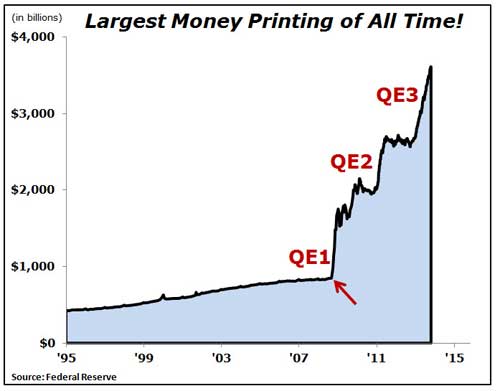
This inflection point — this little spot indicated by the red arrow –is where the Fed throws all its old rule books into the East River.
What happens at that point?
You guessed it! Lehman Brothers fails and the Fed fears a total market meltdown.
That singular moment in time is when the Fed flies off on a new, high-risk trajectory into the outer space of monetary policy.
This is where we see the first outright money printing since the death of the nation’s first currency (the Continental) and the birth of its second (the U.S. dollar).
But the Fed knows that money printing has a bad reputation, that it conjures memories of banana republics and Hitler’s Germany.
So they give it a new name — quantitative easing, QE.
In just three short months, they print more money more quickly than any other time in history. They say it will be limited to a predefined amount. They imply that as soon as that limit is reached, it will end.
The immediate crisis subsides. But the quantitative easing continues. The Fed gives us QE2. And again they say that it will be limited to a predefined amount, hinting that it could end as soon as that limit is reached.
They soon follow up with QE3, but this time with no predefined limit, no finite end. With this not-so-subtle change, they tacitly admit that the limits were bogus, that their real intent is to keep the printing presses rolling 24/7 — till it’s “the right time” to stop, a time which no one, not even they, can possibly know.
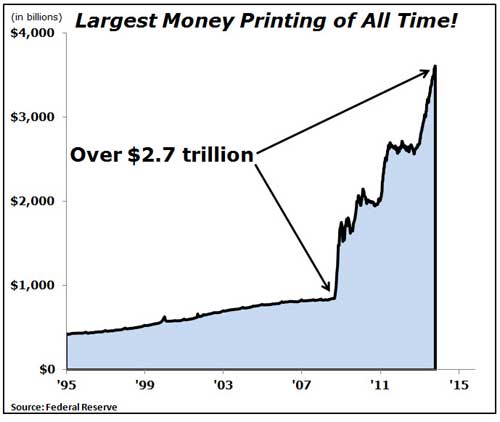
How much money do they print? Again, I take you back to this landmark chart, which I’ve repeatedly brought to the fore in these articles:
- On the day before Lehman Brothers failed in 2008, the monetary base stood at $850 billion — less than $1 trillion.
- Now, it’s $3.6 trillion.
- Thus, since the Lehman Brothers failure, the U.S. Federal Reserve has printed a net of over $2.7 trillion.
In terms of the total dollars involved, it is, by far, larger than anything ever before witnessed on this planet.
Back to the Present, December 2013
We’ve traveled across many years together …
1959: When Eisenhower balanced the budget, proactively prevented inflation, reversed the rise of interest rates and chartered a course for stability.
1971: When Nixon devalued the dollar, cut it loose from gold, and set the nation on a wild ride of deficits, easy money and, ultimately, double-digit inflation.
1979-80. The rise of the bond vigilantes and an historic bond-market collapse.
1994. Another major bond collapse, again because of massive selling by the bond vigilantes.
1995. Rapid expansion in the monetary basis, which helped cause the tech bubble and bust, followed by the housing bubble and bust, leading to …
2008. The failure of Lehman Brothers, the giant debt crisis, the Great Recession and most recently, the greatest money printing of all time, which continues unabated to this very day.
Each episode has brought a new wave of recklessness and layered on a new level of danger:
- First, unrestrained spending by the U.S. government.
- Second, destabilization of the U.S. currency.
- Next, bubbles and busts in the U.S. bond market.
- And, now, money printing machines gone wild.
Compare, for example, where we are now with where we were in 1959, 1980 and 1994 …
Back in 1959, even if Eisenhower had not balanced the budget, the federal deficit would have been about $10 billion.
But today, even if Mr. Obama and the House of Representatives can agree to a so-called “grand bargain,” the red ink in Washington won’t be just three or four times larger than it was in 1959. It won’t be just 10 or 15 times larger. It will be approximately ONE HUNDRED times larger!
Plus, back in 1959, the U.S. government had no debts whatsoever to foreigners. Quite to the contrary, foreign investors owed us a lot more money than we owed them!
Today, over half of our nation’s publicly-traded debt outstanding is held by foreign governments, institutions and individuals. This is critical, because foreign bond vigilantes can be even more vicious than domestic ones. In addition to losing on their bonds, they also lose on their dollars. So they’re willing to dump their bonds that much faster.
Or consider this: Back in 1959, Social Security was deep in the black, with $21.9 billion in reserves. Today, it’s deep in the red, on a collision course with chaos, with $6.5 trillion in unfunded obligations.
Back in 1959, try and guess what the government’s future obligations were to Medicare recipients!
Zero! There was zero in Medicare debts for the simple reason that Medicare didn’t even exist in 1959. Today, between Medicare, Social Security and other unfunded liabilities, America’s net future obligations, based on the government’s own data, is $70 trillion.
Or compare today’s situation with that of 1980 when bond markets collapsed so sharply they forced Carter to drive the economy into recession.
At that time, the federal deficit was under $74 billion. In recent years it has been as much as 1.3 TRILLION. That’s 17.6 times larger in nominal terms. And even in proportion to our GDP, it’s over 3 times larger!
Even if you compare today’s situation with 1994, when we had one of the worst-ever calendar-year declines in bonds, the situation is far more severe today: The recent deficits have been 6.5 times larger in nominal terms and still about 3 times larger in proportion to GDP.
Future Scenario
For quite some time, rising interest rates do not negatively impact the economy or the stock market. They are still too low to bite into corporate profits.
But as we move further into the future, the clouds begin to darken.
Like in the 1970s, the Fed has not only bought huge quantities of bonds, but has helped to create a great speculative bubble in the bond market.
Like in 1979, the Fed Chairman begins to “taper” its bond-buying program.
As in 1980, the Fed’s withdrawal from the bond market, no matter how modest, triggers an avalanche of selling in U.S. Treasury bonds.
Treasury bond prices fall so swiftly government securities dealers withdraw from the market, making it next to impossible for the Treasury to refund maturing bonds — let alone raise new money.
Interest rates, which automatically rise when bond prices fall, surge rapidly.
The most vulnerable are those who can least afford to suffer losses: Seniors who are approaching or in retirement, who have shifted large amounts of their money into fixed income investments.
Their tax-free municipal bonds tank.
Many fixed annuities and other cash-value insurance policies are at risk.
And money invested in weaker bank and insurance company stocks vanishes right before their very eyes.
They are shocked and they ask: “How was this possible? Who are the bond vigilantes? And how come they never did this before?”
The answer: They DID do exactly the same thing before but most people didn’t notice or had forgotten.
We witnessed the power of bond market vigilantes in 1980, at a time when most of them were in the United States. Now it’s much worse because so many are overseas.
We witnessed their power again in 1994, at a time when there was virtually no inflation scare. Now, it’s worse because all the Fed’s money printing is spooking investors about future inflation.
We also saw their power repeatedly in 2011 and 2012, when they dumped the bonds of Greece, Spain and Italy. Now it’s worse because, unlike the situation in Europe, there’s no country or union in the world big enough to bail out America.
Even the most sophisticated investors are shocked. “I thought the Fed could easily fend them off by buying whatever they didn’t want to buy,” they argue. “Why isn’t that working? Why are bond prices collapsing anyhow?” they ask.
The answer: Because in one sense, nothing has changed since Carter’s day of reckoning on April 15, 1980. The most the Fed can buy is measured in billions of dollars. But the bond vigilantes still own trillions of old Treasuries which they can dump on the market. The Fed is overwhelmed by the selling.
But not all is lost.
In fact, in some ways, the bond market collapse is a blessing in disguise. Ultimately, it forces Washington to come to its senses, just like it forced Carter to do the same, just as it forced Greece, Spain and Italy to make long overdue changes.
It also brings several great opportunities to investors.
The first opportunities can come just by following the money. Funds exiting the bond market shift into high-quality stocks and gold.
Another opportunity is to profit from the historic decline in bond prices themselves. And therein lies a very positive change: You now have simple instruments at your disposal, such as inverse ETFs on bonds, that can help you profit from what could be the greatest bull market of our time — the bull market in interest rates.
And the next opportunity is even more appealing. Once interest rates reach a peak, well-informed investors lock in some of the highest safe yields in decades.
Good luck and God bless!
Martin
|
EDITOR’S PICKS
Stock-Market Rally Is ‘Looking Tired’ After 28% Gain by The Money and Markets Team After this year’s advance, the best in a decade, are U.S. stocks poised to decline? Several Money and Markets editors and money managers say that could well be. The Fed, Fearing Japan-Style Deflation, Will Keep Printing Money by Douglas Davenport After last week’s better-than-expected employment report, many investors are predicting that the Federal Reserve will begin to aggressively taper its $85 billion per month bond-buying program. But based on my analysis of technical indicators and my study of economic history, I believe that’s unlikely to happen. Ron Paul to Young People: Getting Involved Trumps Running for Higher Office by Charles Goyette I spoke with Ron Paul in my latest weekly podcast about the former U.S. representative’s advice for the growing number of young people who want to get involved politically, and about the changes Libertarians are bringing about in Washington. |
THIS WEEK’S TOP STORIES
Why I Like Financial Stocks for 2014 by Don Lucek The media have made much ballyhoo in recent days out of the Volcker Rule, which bars Wall Street banks and other financial institutions from using their own money to make speculative investments. Warren Buffett Helps Support my View That Stocks Are Overvalued by Bill Hall Like it or not, it’s a fact: Using any historical valuation metric, the U.S. stock market is overvalued. For example, in last week’s Money and Markets column, I pointed out that the Shiller price-to-earnings ratio was well above its long-term average. . Investors, Run for Cover From the Incoming ‘Taper Bomb’ by Mike Larson Maybe it’s because I just spoke to our German partners and their clients a few weeks ago on the state of the markets. Or maybe it’s the holiday season. But for whatever reason, I couldn’t get the Christmas song “O Tannebaum” out of my head this week. |


{ 1 comment }
As Usual great Insight
Very Possible it could happen again right now –
You have been calling for this for Years so i guess if you call it enough time's you bound to get it right.
It's a shame that with all your good insight and views that you didn't tell people to buy stocks at the 2009 bottom with both hands and a truck. Your research like all others never said that stocks would double, triple or 10 times over return in those 5 years.
INSTEAD you were even recommending shorting the market once the rally was one it's way. (SP was 1100)
I guess you can't get it right all the time – Diversification for Amateurs like us.