 |
Only when the tide goes out do you discover who’s been swimming naked.” — Warren Buffett
A rising tide lifts all boats, right? During a healthy bull market, you see widespread participation — called market breadth — among all stocks.
Conversely, the participation narrows to a smaller number of stocks when a bull market runs out of steam. Sort of a stock-market version of exhaustion.
In the 1960s and ’70s, a group of 50 large-cap stocks was so loved by investors that they were nicknamed the Nifty 50.
These were called “one decision” stocks.
The “one decision” was just to buy them and then hold them forever. The Nifty 50 stocks included long-term winners like General Electric (GE), Coca-Cola (KO) and IBM Corp. (IBM).

However, it also included investment dogs like Xerox, Polaroid, Simplicity Patterns and S.S. Kresge.
Investors loved these stocks so much that they pushed the P/E of these Nifty 50 to a whopping 42 times earnings. At the same time, the broader S&P 500 was trading at 19 times.
In other words, the stock-market tide was still rising. But very few boats outside of the Nifty 50 were rising.
What happened next was the 1973-’74 market collapse that followed the Watergate scandal. This took down the Dow Jones by 45%. However, many of the Nifty 50 lost 70%, 80% … and even 90% of their value!
In retrospect, the narrow participation of the end of the great bull market of the 1960s and ’70s was a glaring, loud and clear warning sign …
Warning! That same type of narrow participation is happening today.
A good way to evaluate market breadth is by looking at the Guggenheim S&P 500 Equal Weight ETF (RSP). This Exchange-Traded Fund equal-weights each of the 500 components of the S&P 500.
To put that into a bit more perspective …
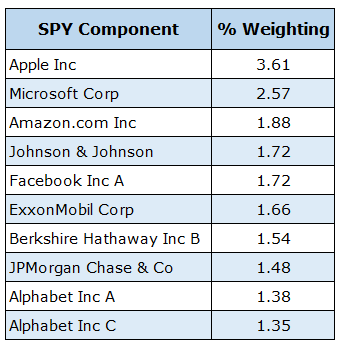
The S&P 500 Index is a cap-weighted index that places more weight on larger stocks like Apple, Microsoft, Amazon, Facebook and Alphabet (Google).
|
|
| Data source: Morningstar.com |
Cap-weighted averages — or proxies like the SPDR S&P 500 ETF (SPY) — can give investors a distorted view of the broader market’s health. Especially if it’s being unduly influenced by a relatively few number of stocks.
On the other hand, an equal-weighted index can give us a better sense of the level of participation across the entire index.
|
|
| Image credit: The Lyons Share |
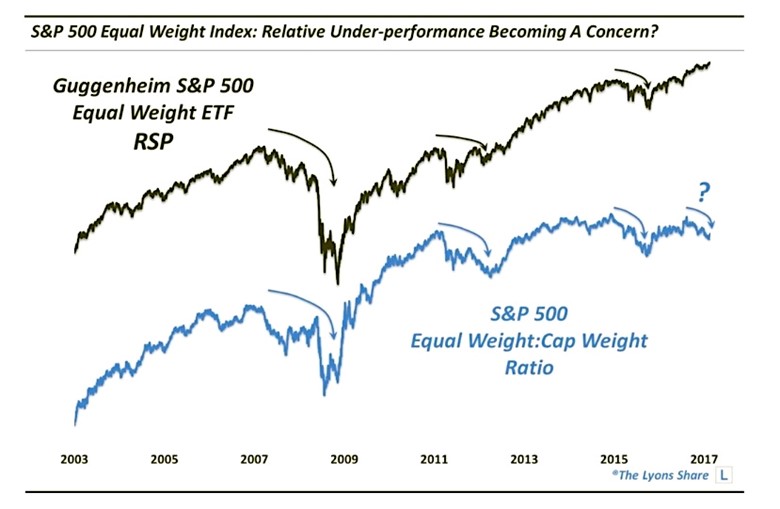
As the accompanying chart shows, the Guggenheim S&P 500 Equal Weight ETF has been trending lower since early December.
In fact, this weak relative strength is a warning sign that has historically signaled trouble ahead.
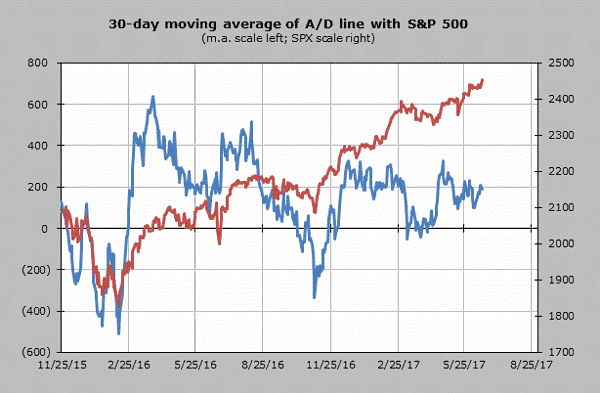
Even as the stock market hit all-time highs in early June, the NYSE advance/decline line did not make an accompanying new high. On June 1, there were 339 new 52-week highs. But that number dropped to 223 the next day.
That’s just another way to say that while the FANG (Facebook, Apple, Netflix and Google) stocks are soaring, the rest of the stock market is failing to follow.
In other words, the current rising tide is not lifting all boats.
|
|
| Image credit: TheStreet.com |
Keep in mind that there are several ways to measure market breadth besides the equal-weighted S&P 500 and the NYSE Advance-Decline Line:
- Percentage of NYSE Stocks Closing Above 200-Day Moving Average
- Relative Performance of Small Caps (Russell 2000) vs. S&P 500
The share of NYSE stocks closing above their 200-day moving average has fallen from a nearby peak of 72% on Feb. 27 to below 60% in June.
Just remember, bull markets are the healthiest when they are broad … and weakest when they narrow to a handful of popular stocks.
If market breadth is any indication — and it has been in the past — the rising tide has hit … or is about to hit … the high-water mark.
The First Grandchild, Hong Kong & Twitter
I guess all us dads enjoy Father’s Day. But mine became extra-special this year when Keiko, my only daughter, revealed the gender of what will be my first grandchild.

My daughter (on the far left) was a cheerleader at the University of Montana, when she met her fiancé, the kicker on the UM football team.
At her baby shower, they filled a plastic football with colored powder, which exploded with one swift kick. That’s how they revealed the gender of their September-arriving child.
Clever and unique, don’t you think?
If you are, like me, a longtime college football fan, you might remember Pat Sullivan. Pat is the 1971 Heisman Trophy quarterback from Auburn University. I also know him as the uncle of Dan Sullivan, the lucky young man who is going to marry my daughter.
Not many families can claim a Heisman Trophy winner. But I can tell you with great pride that they are even better people than they are athletes … and that is saying a lot!
I was only able to bask in the news for a few days before flying to Hong Kong, one of the most beautiful cities in the world. Why? Not for fun, but to search for the next investment home run.
I have several meetings lined with some of the most exciting Asian technology companies in the world. And I hope you’ll join me in the next generation of profitable stocks that I expect to find.
Of course, there are many reasons to be worried about the stock market. If you’d like to peek over my shoulder at the economic, business and corporate news that intrigues and/or worries me the most, follow me on Twitter here: @Tony_Sagami
Best wishes,
Tony Sagami


{ 2 comments }
Warmest congrats for a soon-to-be grandpa and warmest congrats to your daughter
and hubby too.
I believe you have the labels incorrect/switched in the second chart “S &P equal weight…” as the blue line is dipping at the most current end of the line. But still very good chart reading information, thanks.