The Dow Industrials smashed through the 25,000 level yesterday. What a way to ring in the new year!
That’s right on the heels of the blue-chip index busting through the 24,000 barrier on Nov. 30. That was only about a month ago!
This latest milestone was just 35 calendar days in the making. It joins the Dow’s surge from 20,000 to 21,000 last March as the fastest thousand-point jump in the index’s 120-year history.
The Nasdaq, not to be outdone, just saw its strongest three-day winning streak in 12 years. The tech-heavy index soared past the 7,000 mark on Wednesday.
And you know what’s going to happen next?
My crystal ball says U.S. stocks and certain emerging-market companies — especially a select group with a growth-oriented bent — are going to shoot even higher in 2018!Â
How do I know this?
The Single ‘Magic Metric’ That Tells You
Where Stocks are Headed at Any Given Time
It’s because, as a professional money manager, I have a Magic Metric that I watch like a hawk. It signals where the stock market is headed. And that’s why, if you’ve been reading my Friday morning columns for the past year, you aren’t the slightest bit surprised by the stock market’s relentless march higher.
What’s this key market stat? It’s the yield on the 10-year U.S. Treasury!
|
Where are the markets headed? Have you ever wondered what the pure, unbiased, DATA is showing? I know I’m constantly thinking about that, and it’s why I get so much use out of the Weiss Ratings website. My colleagues over there have a completely independent, unbiased, and proven analytical model that covers more than 14,000+ stocks, ETFs, and mutual funds trading in the U.S. or Canada. Best of all, they publish a free daily email newsletter that tells investors what they’re data is showing about trends in all of those investments. You can sign up to receive that critical intelligence here. |
You can use this magic metric to position your portfolio for profits as the stock market continues to skyrocket upward in 2018. But that’s not all it can do for you …
The 10-year U.S. Treasury yield can also warn you about any impending pullback. That way, you can get defensive and protect your precious investment capital as needed.
This top-of-the-food-chain indicator can tell you more at a glance than you’d get from reading multiple financial publications … sifting through countless articles on the Internet … or spending hours watching CNBC or Fox Business.
Indeed, this one simple statistic should be the cornerstone of your investment research process …
Looking back, as we headed into 2017, the 10-year yield stood at 2.45%. And despite last year’s big run-up in stocks … three interest-rate hikes by the Federal Reserve at the short end of the yield curve … and Fed Chair Janet Yellen’s incessant posturing about higher interest rates, the 10-year has barely budged over the past 12 months, recently closing at about 2.44%.
That’s a hardly noticeable change of only 1 basis point over the course of the year. That’s right — one measly basis point move, looking back to where we were at this time last year!
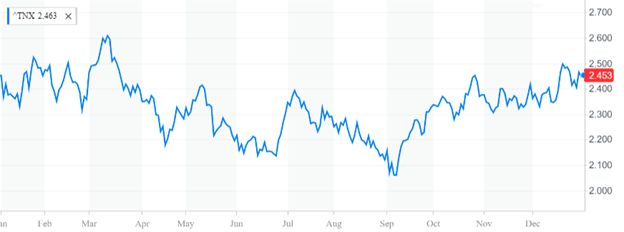
Image credit: Yahoo! Finance
With the 10-year U.S. Treasury yield at 2.44%, think of it this way …
Current 10-year U.S. Treasury buyers are exchanging their precious investment capital for a cash-coupon payment of 2.44% and the return of their original investment 10 years from now …
And they are doing so with NO HOPE FOR GROWTH. Not in either the coupon payment or the capital investment returned at the end of their 10-year holding period.
That doesn’t seem like a very good deal to me. Not with the dividend yield on some high-quality growth stock sitting at just around the 2.5% level.
What’s My Magic Metric
Telling Me About 2018?
To help you make your buy, sell and hold decisions in 2018 for your nest egg, here’s a chart that I keep on my desk. It summarizes the three ranges I see for 10-year U.S. Treasury yields and my current forecast for their corresponding impact on U.S. stock prices.
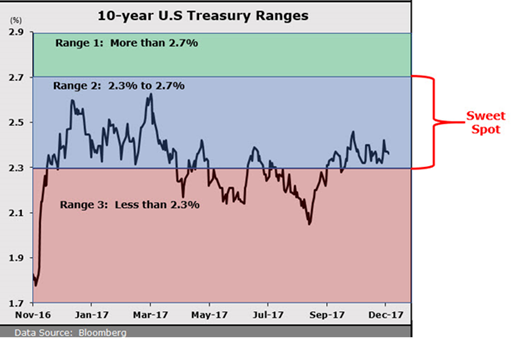
The Sweet Spot 2.3% to 2.7%: Should the 10-year stay in this range, stocks will continue to march higher … likely breaking through the 30,000 level on the Dow sometime before the end of 2018.
More than 2.7%: If the 10-year shoots up above 2.7%, the Trump-reflation trade is on and stocks could continue to head higher. On the other hand, if the surge in economic activity is too-much-too-fast — and it causes inflation to return with any significant velocity — prepare yourself for a stock market pullback in the range of 10% to 20%.
Less than 2.3%: If the 10-year falls significantly below 2.3% and stays there for any extended period, deflationary forces have regained the upper hand. That means it’s “look out below” for stocks worldwide. And we may finally get the global stock market meltdown that many bears have been telling us is inevitable.
There’s a lot of powerful information for your portfolio in this thumbnail summary of interest-rate levels. Keep it handy for future profits!
In fact, a great idea would be to write these levels down and keep them close by. Then, when you’re ready take a gander at the markets, you can use these levels to follow along.
As for me, I think interest rates will be lower longer than most are expecting. That’s because the world’s central bankers have no other choice but to keep their magical money machines humming along to churn out an endless supply of cash.
This makes for an environment of pure bliss for investors who focus on the world’s finest growth stocks. Names that can grow their bottom lines through thick and thin.
Throughout this new year and long beyond, I’ll continue to keep a keen eye on Magic Metric to provide an early warning of potential storm clouds brewing.
And now that you have my handy reference chart, you can do the same.
Fair winds and following seas to you all,
Bill Hall
 Bill Hall is the editor of the Safe Money Report. He is a Certified Public Accountant (CPA), Chartered Financial Analyst (CFA) and Certified Financial Planner (CFP). Besides his editorial duties with Weiss Research, Bill is the managing director of Plimsoll Mark Capital, a firm that provides financial, tax and investment advice to wealthy families all over the world.
{ 5 comments }
Low rates more bubbles
Well, that’s 2018 in the bag then, with the world’s central bankers have no other choice but to keep their magical money tree growing to churn out an endless supply of cash fruit making an environment of pure bliss for investors who focus on the world’s finest growth stocks. Names that can grow their bottom lines through thick and thin.
Now Bill, do you have any stock names for us then???
Thank You that was a great insite and an easy to understand concept. I hope it holds true and will use it to factor my decisions in the future.
We are in for a bull market in the stock market, possibly we are also in for a boom in the commodities market. The commodities market is the market for gold and oil. Possibly we are in for one of the biggest booms the world economy has ever seen. We are in a kondratieff cycle of 45 to 60 years. We might even be in a Kuznets cycle of 15 to 20 years. We might even be in a jugular cycle of 7 to 12 years. We might even be in a kitchin cycle. The kitchin cycle is a 40 month cycle of prosperity, recession, depression, and improvements in the economy. The economic cycle always through the 5 key phases of boom, recession, depression, recovery and growth.
What’s gonna happen to inverse etfs? Are we in for a gold tranche? A return to the gold bullion standard? Maybe even a gold avalanche? Could we be in for a gold rush? We might even be in for a gold avalanche? Whereabouts in this boom, recession, depression, recovery and growth cycle are we at. What’s gonna happen to leverged etfs? Are we in for a boom, in leveraged etfs, unleveraged etfs, mining stock, futures, options. If we have options we are dealing with either either call option or a put option. If we have a put option, that means we are putting someone else of the option. Put Options are far less risky than call options. Inverse etfs are what to get into. Maybe we are in for a gold rush. Maybe even a gold rush, We could be in for a rise in the exchange rates, with exchange rates set to be either fixed or flexible exchange. We are in for a big boom in the economy. An even bigger boom then the last boom. Leveraged etfs, unleveraged etfs, mining stock, futures and options.