 |
Just as we predicted over two years ago, a tidal wave of money has given the bull market amazing superpowers — to overcome resistance, leap over obstacles and charge to ever-higher new highs.
And just as we reveal in Countdown to Armageddon — our blockbuster gala issue just posted on The Edelson Institute website — the stock market is NOT climbing a wall of worry … as some analysts think … it’s rising despite all the global threats and economic instabilities in the world today.
The fact is, U.S. stocks are surging higher because of those troubles: Just as we said it would, the crises overseas are driving wealthy foreign investors to the safest safe haven on the planet — the United States.
The bull market that began in March 2009 is now the second-longest of all time. Plus, it’s the second-strongest bull market of all time in price appreciation. And it’s the third-best in total return, dividends included.
The bulls have been running on Wall Street for 3,111 days and counting. Over those 8.5 years, the blue-chip index is up 267.8%, overtaking the 1949-’56 bull market as the second-best ever.
Yet, you might say it is the “most-hated” bull market in history.
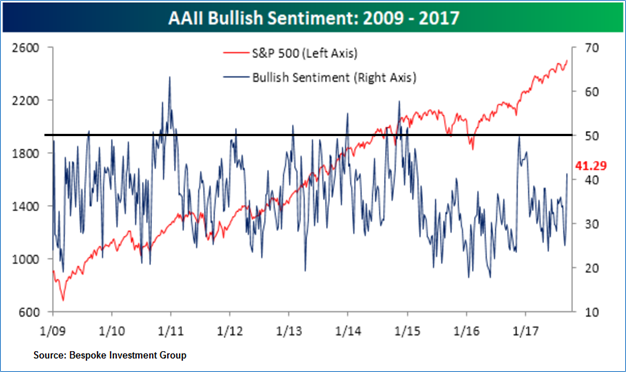
How do we know? Well, according to the time-honored survey data from the American Association of Individual Investors, bullish investor sentiment has remained extremely anemic despite new record highs.
Sure, it ticked slightly higher last week, to 41.3% …

But the fact remains: Bulls have been in the minority, below 50%, for a record 141-straight weeks!
And it’s easy to see why. There are so many investors who have been waiting, in frustration, for the correction that never comes.
In fact, it has been 581 days since the stock market last experienced a 10%+ correction, according to data from Bespoke Investment Group. That was way back in February 2016.
And, starting in June 2016, stocks have gone 444 days without so much as a 5% pullback!
There are few things more certain in financial markets than the principle of regression to the mean. That is: What goes up must (eventually) come down. Markets swing to-and-fro like a pendulum.
|
|
| The historic bull market has been running for 8.5 years. |
And in my own experience of nearly 30 years in this business: The more extreme the swing is in one direction, the more severe the counter-swing in the opposite direction.
Please note that 444 days without a 5% stock market pullback is extreme … in the extreme.
Typically, stocks pull back 5% or more about three times each year. But the last time that happened was 15 months ago.
Again, based on history, you can expect a 10% correction about once a year. But it’s been almost two years now without one.
To say we’re overdue is to put it mildly.
Please understand that I’m not calling for an imminent market crash. Nor am I saying that the bull market is coming to an end. If anything, the next correction — whenever it does finally come — will be a great buying opportunity.
Here are two red flags to watch for to signal a deeper correction, and subsequent buying opportunity …
#1 – Volatility: The CBOE Market Volatility Index (VIX) fell to record lows just a month or so ago, but has ticked higher in recent weeks. Likewise, a similar measure of turbulence in bond markets is also on the rise.
Markets will often experience steadily rising volatility before a correction. Then these “fear gauges” will spike even higher as markets decline. Consider this: The Nasdaq fell more than 10% on six separate occasions within a period of just 12 months before the tech bubble finally burst in 2000!
Rising market instability is a good sign of a correction coming. The same is true for central bankers’ actions (and it just so happens the Fed kicks off its two-day September meeting tomorrow) …
#2 — Credit: Stock and bond market corrections are frequently preceded by a tightening of credit conditions. So, keep a watchful eye on interest rates.
Especially vulnerable are junk bonds, and there are a record number in circulation today. Global issuance of high-yield bonds so far this year is running at an annualized pace of nearly $500 billion. That’s an all-time high.
If junk bond prices start to plunge, it’s a sure sign credit conditions are tightening. And a stock market swoon may not be far behind.
Bottom line: There are plenty of signs of excess on Wall Street today. Plus, stock market valuations — while not quite at “irrational exuberance” levels — are uncomfortably high from a historical perspective. These conditions make a market correction all the more likely. For a very explicit description of some of the great opportunities, it will open up, be sure to read our gala issue before 5 p.m. Eastern time tomorrow, Tuesday, Sept. 19.
Good investing,
Mike Burnick

 Mike Burnick, with 30 years of professional investment experience, is the Executive Director for The Edelson Institute, where he is the editor of Real Wealth Report, Gold Mining Millionaire, and E-Wave Trader. Mike has been a Registered Investment Adviser and portfolio manager responsible for the day-to-day operations of a mutual fund. He also served as Director of Research for Weiss Capital Management, where he assisted with trading and asset-allocation responsibilities for a $5 million ETF portfolio.
{ 3 comments }
A major correction is certainly over due. If it arrives, it may cause misery to those who are not mentally prepared! Good luck!
The only running bull in the market is USA debt n foreigners avoidance of holding the dollar.The king of con-Feds have printed dollars like toilet paper to service debt n stupid foreign investors. What most fear is the dollar crashing n the Feds raising interest rates. This will crash the stock prices but not US economy. The gold horders will find their investments competing with bargain price blue chip stock. The Feds then will face their demise as a trusted service provider. In this coming storm one can expect rebellion n war on global scale.
Was this expected? Certainly. Why else would the government order expansion of secure holding aeras n Walmart entering the providers of such for FEMA. HAVE DOUBTS WELL VIEW THE CHEM TRAILS BEING DEPLORED DAILY WITHOUT BEING A MEDIA EVENT.
I am very interested in investing in cobalt, and would
like information about this. I would like to know who is mining it in the USA and specifically where. I am in the scrap metal business and would like to research companies who I could buy cobalt from. Please help
with my research efforts!