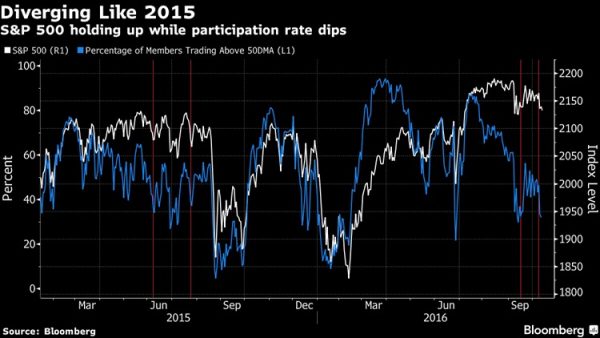
I run across all kinds of analyses on the market. But I found this one from Bloomberg to be pretty interesting. It says that while the S&P 500 may be trading roughly sideways, the average stock in the index is performing much worse. Check out the chart below. Most of the time when the S&P 500 is strong, you get a high percentage of underlying stocks trading above their 50-day moving average. But since July, the number of S&P 500 constituents managing to do so has been deteriorating.
The story says these divergences USUALLY end with the average playing “catch down” to the average stock. But what’s really interesting is that there have been two “warning sign” instances within only a few months of each other. The only time that happened before? December 1999 and February 2000. You probably don’t need me to tell you what happened next. Just some food for thought during this incredibly volatile week!

